It’s been a
very interesting 9 months detail studding Smartlands, but I decided when doing previous
update to sell my SLT (and my other tokens). SLT was a good investment for me but somehow a disappointment after the price drop over the last months.
What have I
learned (allot!) and what are my conclusions?
- It’s early days, I think it will be several years before we see a broad-based adoption of crypto based services
- Same pattern for all 18 tokens I follow: Good/OK project deliveries, dropping token prices, very few new participants (wallets), crowed shout out for marketing and more exchange listings
- I’m back in the Bitcoin maximalist camp – I think most crypto based services will be paid in Bitcoin through some kind of blockchain interoperability protocol leading to the valuation of a token to be only the “utility value” (see previous thinking here). For SLT it’s the staking that can create a higher price but it will be tricky if only a few other holders see it as a store of value
- In the data I have collected I have found the change in number of wallets to be most useful. It’s been interesting to follow the large wallets, the numbers have been remarkable stable but beside that fact it’s been stable I have found no real use of the numbers (maybe that is good enough?)
- For Smartlands – have not changed my view from my writing here and here. The release of the new plan some weeks ago is a mix of good news and a question mark about if there ever been a “grand plan” or most actions are result of an agile adoption to new findings
This will be my last update, at least for a while. I wish both the SLT holders and the Smartlands team the best of luck and success!
Total assets holders and new wallets


Large wallet analyzes


Index
calculated as weekly wallet change quantity divided over unchanged quantity,
e.g. this week change (New 56.754 + Buy more 51.358 + Sold parts 54.385 + Not in list 44.627) divided by Total 6.484.920 = 3,19%.
Top 10 wallets & key individual wallet changes since last update

- Among top 10, two wallets selling out 20k each
- Largest sell had rank 14 in May update, she sold out the 137k in the wallet. 7 more wallets sold >10k
- Largest buy is 30k in a new wallet. 8 more wallets added >10k
Changes in large wallets from December 10 to today


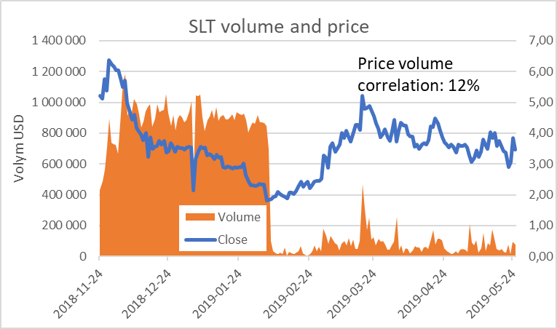
Price and volume analyze
CoinMarketCap
have for some reason excluded the SDEX volumes, so no volume information.


Upper and
lower bounders calculated as 95% probability to be within this range, based on
the standard deviation for the period.
Graph below
shows the 30-day trend value for last 6 months, trend above 0 indicates higher
trend, below decreasing price trend.


Index
below contains 18 tokens equal weighted, starting date December 15, BitCoin low after
2017 peak.

Data
sources:
Link to
Smartlands