Looks like
we got a “buy the rumor, sell the news” price development. I have noticed same
pattern for other tokens: announcement, excitement and higher price, event
happening but few new wallets, price drifting lower and last, calls for
marketing.
I think
marketing is a tricky question, will there be any new purchases from people
planning to hold SLT right now? On the other hand, a risk of waiting for the
crypto bear market to turn is that it might by difficult to be seen in the
crowd of crypto projects marketing at the same time. Right now, I’m in the camp
to not to spend any marketing money and focus on the ABTs and get the trading
of them set up.
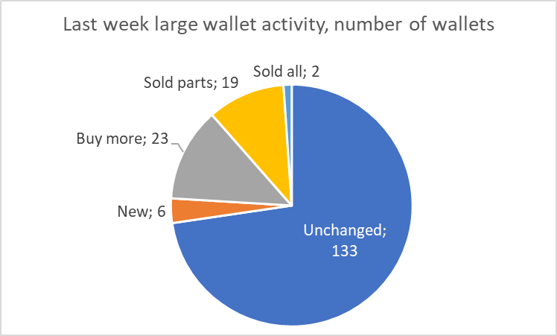
There have
been some interesting moves among the large wallets:
- The #1 rank wallet have sent 20k to the Bitrex wallet adding to the previous 9k ([Bittrex]GB6YPGW5JFMMP2QB2USQ33EUWTXVL4ZT5ITUNCY3YKVWOJPP57CANOF3)
- Rank #4 moved 19k to what looks like a trading wallet but only 2k was sold out
Beside
above, about the same numbers as last week.
Next update
will come when I see something interesting, so no update, no major changes.
Total assets holders and new wallets


Large wallet analyzes


Top 10 wallets & key individual wallet changes

Changes in large wallets from December 10 to today


Price and volume analyze

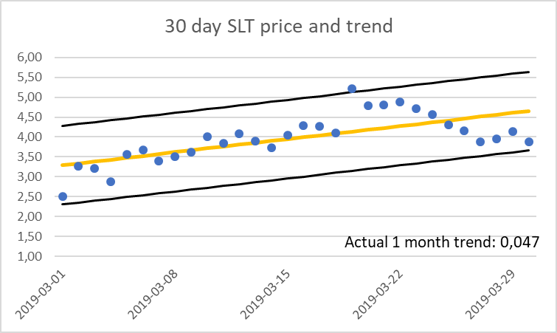
Upper and
lower bounders calculated as 95% probability to be within this range, based on
the standard deviation for the period.
Graph below
shows the 30-day trend value for last 6 months, trend above 0 indicates higher
trend, below decreasing price trend.


SLT
velocity calculated as Weekly trading volume/average weekly SLT price (to
express the trading volume in SLTs) * 52 (to annualize the volume) divided by
Total SLT and Non HODL quantity.

Data
sources:


Inga kommentarer:
Skicka en kommentar