söndag 31 mars 2019

Weekly analyze March 31, 2019

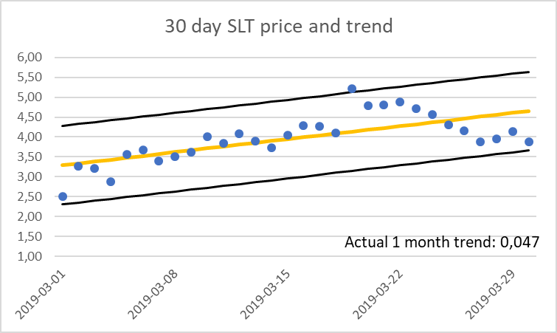
Looks like we got a “buy the rumor, sell the news” price development. I have noticed same pattern for other tokens: announcement, excitement and higher price, event happening but few new wallets, price drifting lower and last, calls for marketing.

I think marketing is a tricky question, will there be any new purchases from people planning to hold SLT right now? On the other hand, a risk of waiting for the crypto bear market to turn is that it might by difficult to be seen in the crowd of crypto projects marketing at the same time. Right now, I’m in the camp to not to spend any marketing money and focus on the ABTs and get the trading of them set up.

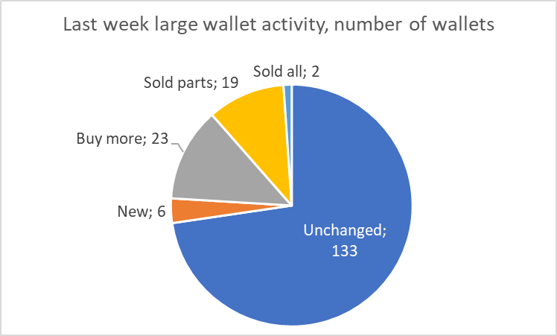
There have been some interesting moves among the large wallets:

  • The #1 rank wallet have sent 20k to the Bitrex wallet adding to the previous 9k ([Bittrex]GB6YPGW5JFMMP2QB2USQ33EUWTXVL4ZT5ITUNCY3YKVWOJPP57CANOF3)
  • Rank #4 moved 19k to what looks like a trading wallet but only 2k was sold out
The move from rank #4 is a little bit bothering. Most likely a wallet connected to the Smartlands team with insider information selling out. There is of course allot of reason to sell but if someone close to the team think it’s time to sell it is some kind of sign and I will follow the wallet a little bit more in detail.

Beside above, about the same numbers as last week.

Next update will come when I see something interesting, so no update, no major changes.


Total assets holders and new wallets


Large wallet analyzes

Index calculated as weekly wallet change quantity divided over unchanged quantity, e.g. this week change (New 39.768 + Buy more 35.019 + Sold parts 64.048 + sold all 9.662) divided by Total 6.496.696 = 2,29%.

Top 10 wallets & key individual wallet changes

Among top 10, rank 1, 4 and 5 decreased their holdings. #1 was moved to the Bitrex wallet and that was the largest increase and second largest increase was the receiving wallet from #4.

Changes in large wallets from December 10 to today


Price and volume analyze


Upper and lower bounders calculated as 95% probability to be within this range, based on the standard deviation for the period.

Graph below shows the 30-day trend value for last 6 months, trend above 0 indicates higher trend, below decreasing price trend.

SLT velocity calculated as Weekly trading volume/average weekly SLT price (to express the trading volume in SLTs) * 52 (to annualize the volume) divided by Total SLT and Non HODL quantity.


Data sources:


söndag 24 mars 2019

Weekly analyze March 24, 2019

More and better news then I had anticipated but the announcements did not have any real impact on the number of new SLT holders. Time for a marketing campaign? 

Some movements among the large wallets (>3.000 SLT), alomst a third of them made transactions and among them, one new wallet ending the week with 23k.

Total assets holders and new wallets


Large wallet analyzes


Index calculated as weekly wallet change quantity divided over unchanged quantity, e.g. this week change (New 51.763 + Buy more 25.695 + Sold parts 40.154 + sold all 46.703) divided by Unchanged 6.009.520 = 2,53%.

Top 10 wallets & key individual wallet changes

No activity among top 10 wallets.
 

First transaction from top was rank 20 with a sell of 2k ending up with 60k. First buy from top was rank 24 adding 4k ending up with 52k. 

Largest 
  • decrease was 10k in a wallet ending up with 8k
  • increase was 25k in a new wallet followed by 15k ending up with 23k
 

Changes in large wallets from December 10 to today


Price and volume analyze


Upper and lower bounders calculated as 95% probability to be within this range, based on the standard deviation for the period. 

Graph below shows the 30-day trend value for last 6 months, trend above 0 indicates higher trend, below decreasing price trend.

SLT velocity calculated as Weekly trading volume/average weekly SLT price (to express the trading volume in SLTs) * 52 (to annualize the volume) divided by Total SLT and Non HODL quantity.


Data sources:

söndag 17 mars 2019

Weekly analyze March 17, 2019

Not much to report from the large wallets (>3.000 SLT), same kind of patterns as we have seen before and the number of wallets and holding at same level as last time I posted.

Interesting week in front of us, will we see increased numbers of new wallets, more SLT holders and a tick up in volume?

SLT holders and new wallets


Large wallet analyzes

Index calculated as weekly wallet change quantity divided over unchanged quantity, e.g. this week change (New 25.808 + Buy more 10.916 + Sold parts 13.180 + sold all 30.955) divided by Unchanged 6.071.350 = 1,24%.

Top 10 wallets & key individual wallet changes

There has been one change in a top 10 wallets since last, rank 5 sold out 13k ending up with 157k.

The largest decrease have been -30k on rank 18 ending up with 80k.

A wallet that was on the large wallet list beginning of January came back again, this time from 0 to 38k in one week, the largest increase.

Beside above, some movements between wallets (+10.455 in one, -10.455 in another one) but otherwise nothing that catch my attention. 

Changes in large wallets from December 10 to today


Price and volume analyze

Bounders calculated as 95% probability to be within this range, based on the standard deviation for the period. 

Graph below shows the 30-day trend value for last 6 months, trend above 0 indicates higher trend, below decreasing price trend.

SLT velocity calculated as Weekly trading volume/average weekly SLT price (to express the trading volume in SLTs) * 52 (to annualize the volume) divided by Total SLT and Non HODL quantity.


Data sources:


SLT analyze July 24, 2019

It’s been a very interesting 9 months detail studding Smartlands, but I decided when doing previous update to sell my SLT (and my other tok...